
TRADING JOURNAL
Find out why you lose money.
Your fills sync from your broker on their own. What you get back is not another P&L chart - it is the setup, the hour, the size and the habit behind every red day, named and ranked.
Free plan available. Read-only broker sync or a CSV.
Brokerages synced read-only
Performance metrics
Deep-dive reports
Trades typed by hand
A losing month is rarely one bad trade. It is one bad habit, thirty times.
TIME OF DAY
The hour that eats the week
Your green days and red days are rarely random. One session window usually carries most of the damage - and it is the last thing a spreadsheet shows you.
SIZE
Size creeping after a loss
Average winner, average loser, and the size you took on each. When revenge sizing is in the data it stops being an argument.
SETUP
The setup you love and lose on
Tag every trade with the play you thought you were taking, then read expectancy per tag. Favourites and earners are not always the same list.
PROCESS
The plan you abandoned mid-trade
Planned stop against actual exit, on the chart, with the note you wrote at the time. The gap between plan and click is where the money went.
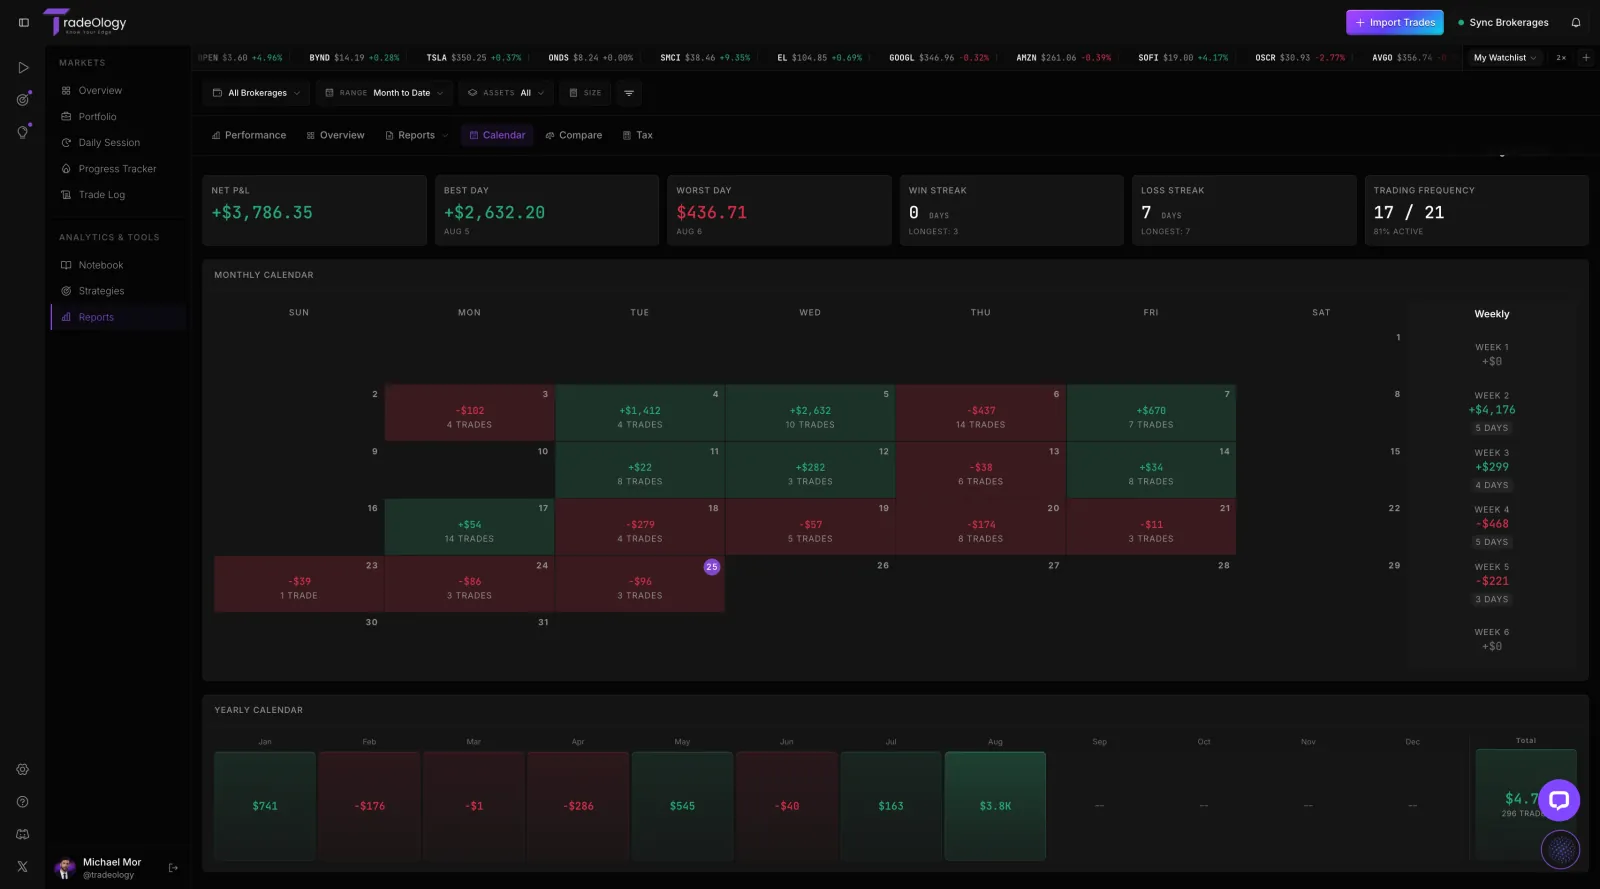
Calendar and heatmap
Every trading day coloured by result, so a month of habits reads in one glance.
The read here is not the total. It is the shape: which weekday is consistently red, and how often you traded on days you had no business trading.
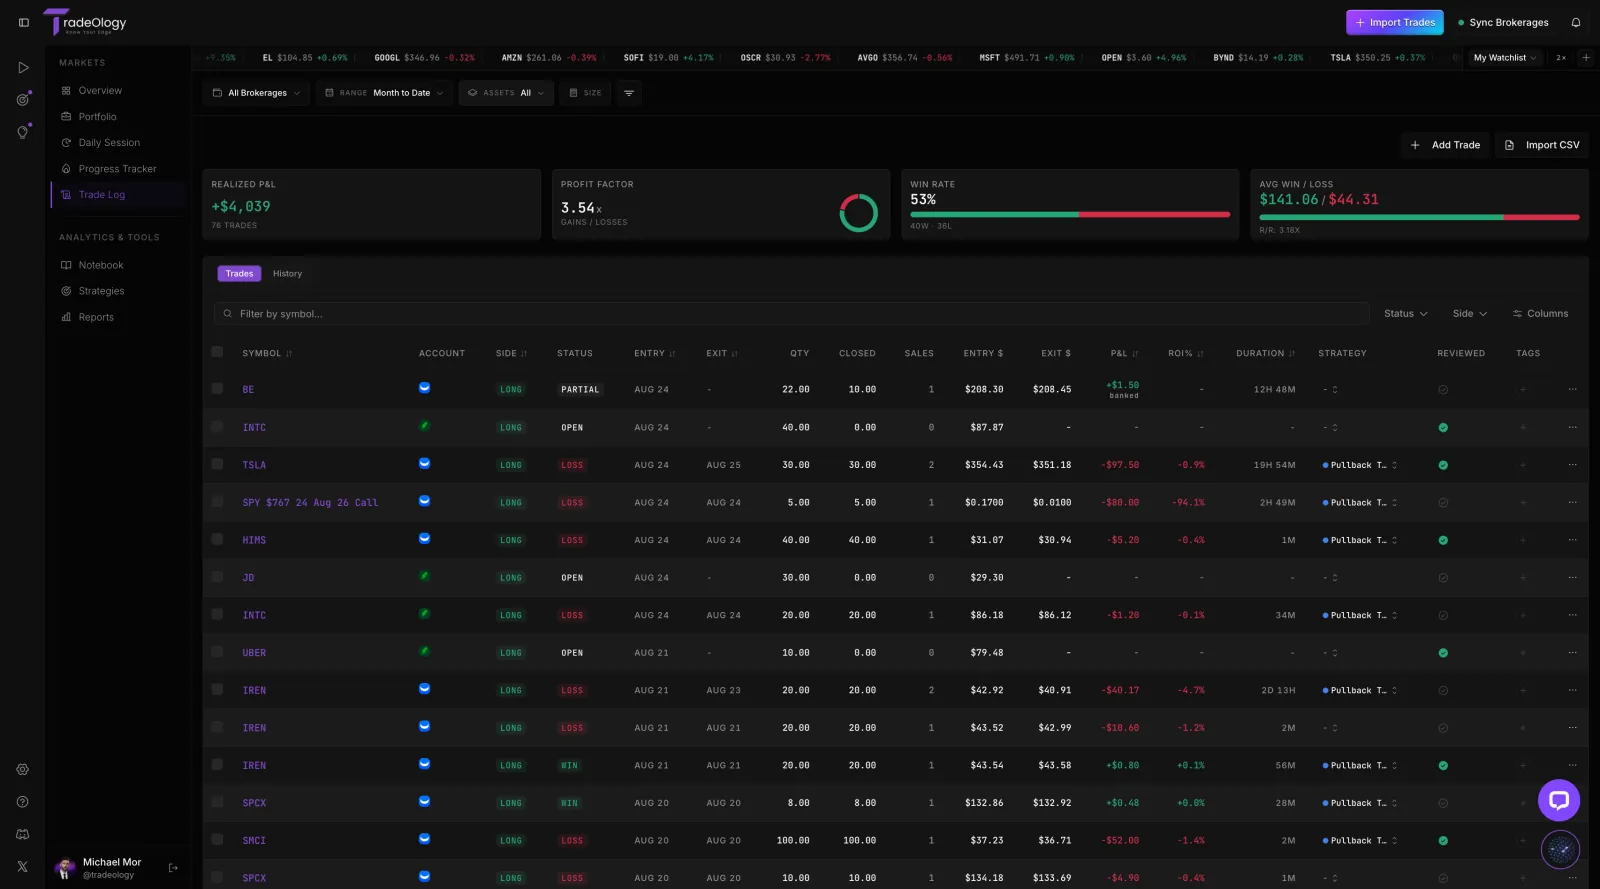
Trade log and filters
Every fill your broker reports, in one table you can interrogate.
Sort by ROI, filter to one strategy, and the worst five trades of the month stop being a memory and become a list you can work through.
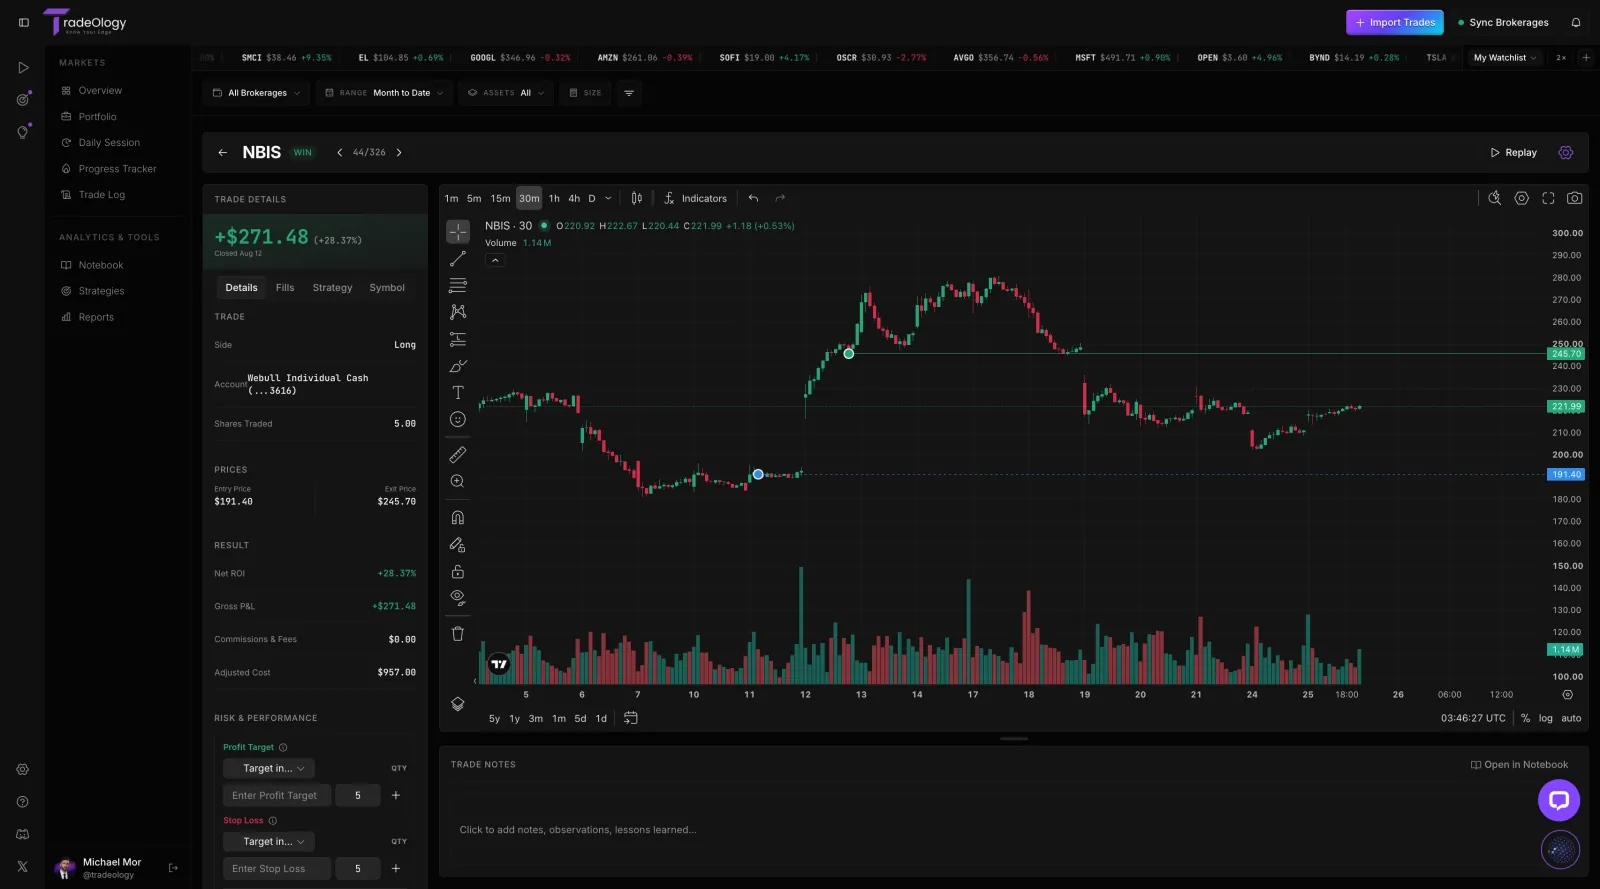
Trade detail and replay
Your real entries and exits marked on the chart, beside the note you wrote at the time.
Most of the honest work happens on this screen. It is hard to argue that you followed the plan when the plan and the fill are on the same chart.
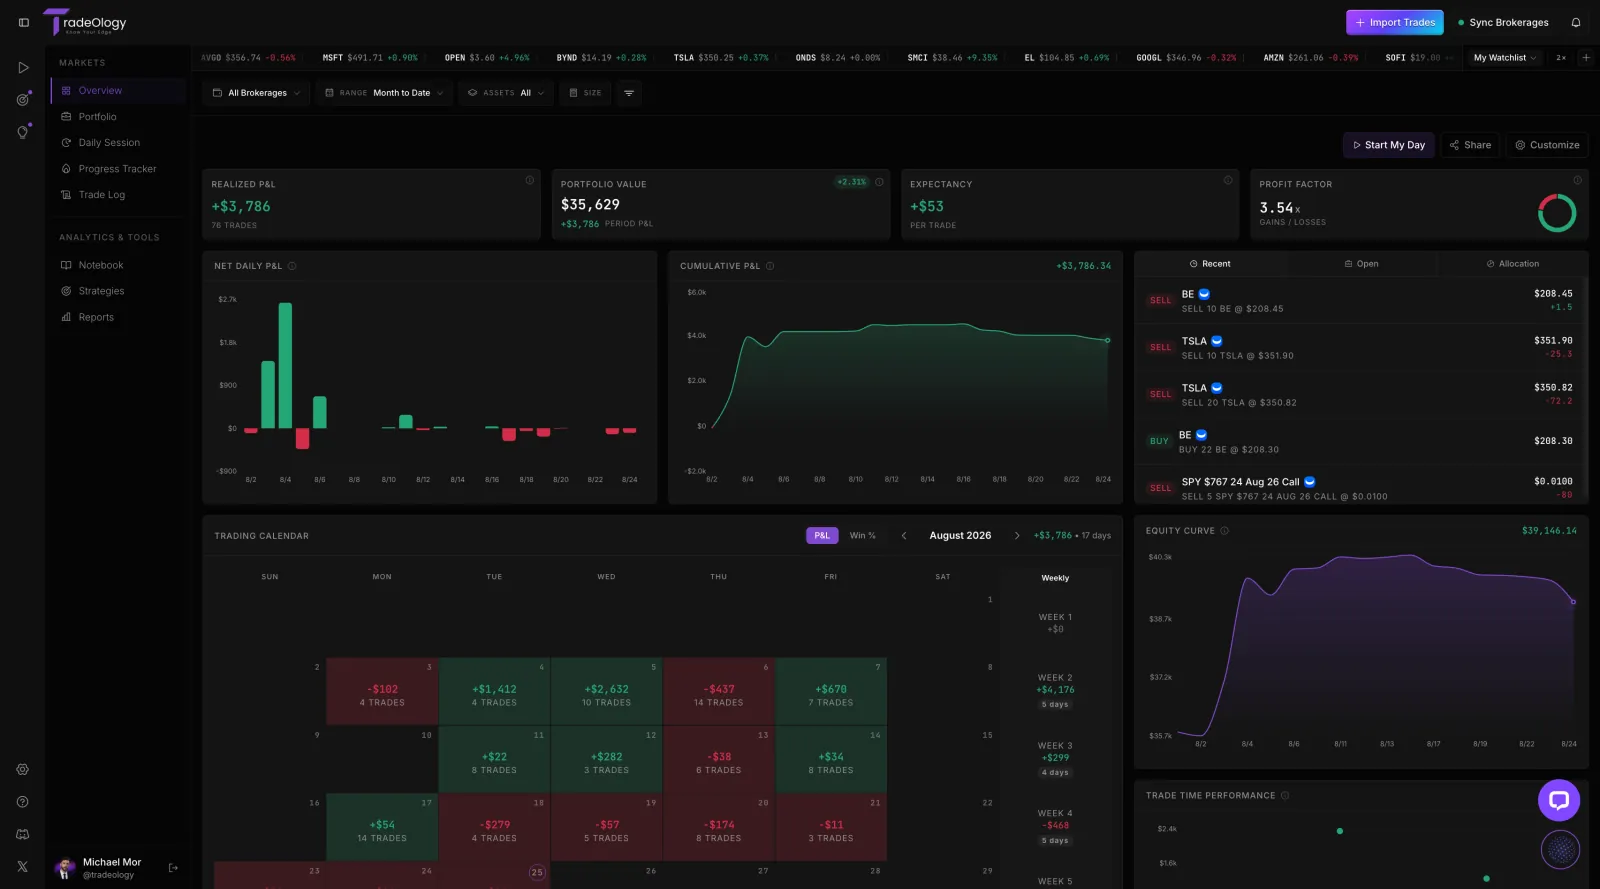
Reports and metrics
Forty plus metrics and eleven deep-dive reports, computed from the synced record.
Expectancy per trade is the number to watch. It survives a hot streak, and it tells you whether the last month was edge or weather.
ALSO INSIDE
The parts that turn a record into a routine
Notes and tagging
A trade with no context is a row of numbers. Tag the setup, rate the execution, and write the note while the screen is still in front of you.
Playbooks and strategies
Write down what a setup is supposed to look like, then hold the fills against it. Every strategy gets its own expectancy, win rate and trade list.
Ask Oly
The AI layer reads your own history, not the internet. Ask in plain English and the answer comes back with the trades attached so you can check the work.
IF YOU KEEP A SPREADSHEET
The spreadsheet is not wrong. It is just late.
Most traders quit journalling for the same reason: the entry happens hours after the decision, so the record is thin exactly where the lesson was.
"I thought my problem was entries. Two weeks in the journal and it was obvious: everything I opened after 2pm bled. I stopped trading the afternoon and my worst week of the next month was flat instead of down four figures."

Shai G. · Austin, TX · Webull · 296 trades journalled
Questions traders actually ask
No. Connect one of 25+ brokerages read-only and your history backfills, then keeps syncing forward. If your broker is not on the list, drop in a CSV - Oly can parse formats we have never seen. Manual entry exists for the odd off-platform fill, not as the main path.
Point it at your own history
Connect a broker read-only or drop in a CSV. The backfill runs, the reports read, and the first uncomfortable pattern usually shows up the same evening.